
Key findings
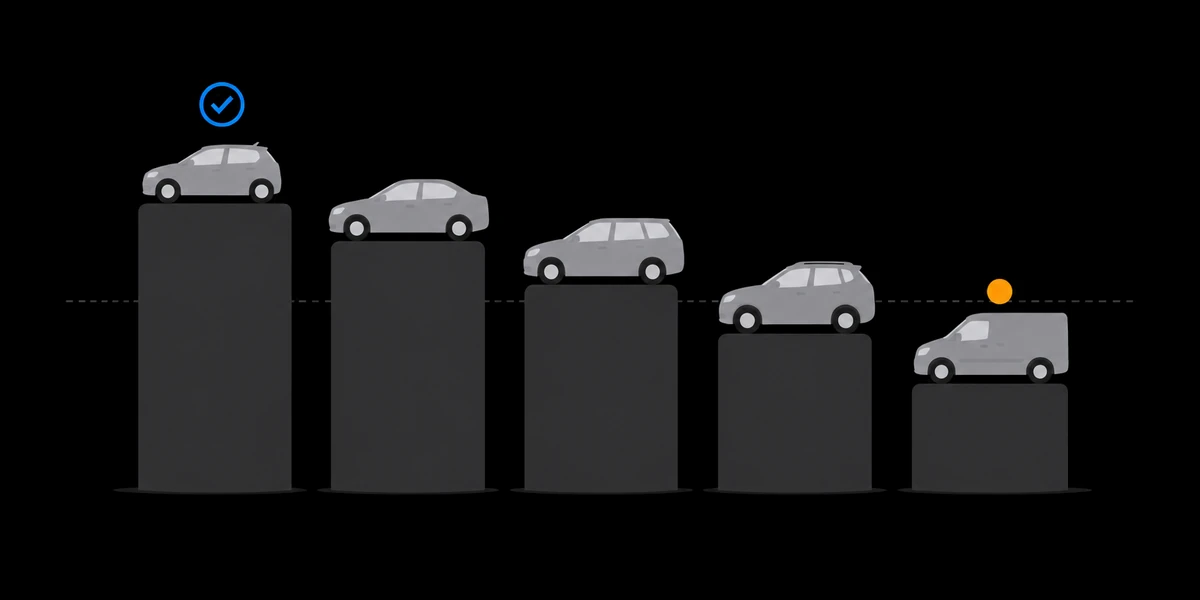
- The Porsche 911 (94.5%), the Porsche Boxster and the Honda Jazz (91.4%) had the highest MOT pass rates of 119 car models, compared at the same ages. 8 of the top 15 are from Japanese brands.
- The Renault Clio had the lowest, at 71.2%, followed by the Renault Megane and the Peugeot 5008. 10 of the bottom 15 are Renault, Dacia, Peugeot or Citroen models.
- Age matters more than make. Across all cars and vans the pass rate falls from 89.4% at 3 years old to 72.7% at 10, a drop of 16.7 points. Some models barely move over those seven years; the Renault Captur drops 28.8 points.
- Mileage explains little of the gap between models. The Toyota Prius typically shows 108,000 miles at these ages, against 53,000 for the average ranked car, and still ranks 5 of 119.
- Popular does not mean dependable. The four most-tested cars rank the Ford Fiesta 92nd, the Ford Focus 68th, the Vauxhall Corsa 111th and the Volkswagen Golf 23rd, out of 119.
Why compare at the same ages
A model's raw pass rate depends heavily on how old its cars are. Across every car and light van tested in 2023, 76.5% of initial MOT tests ended in a pass, but that hides a steep slide with age.
Show the data
| Age (years) | Pass rate |
|---|---|
| 2 | 90.2% |
| 3 | 89.4% |
| 4 | 88.0% |
| 5 | 85.9% |
| 6 | 83.6% |
| 7 | 81.1% |
| 8 | 78.3% |
| 9 | 75.2% |
| 10 | 72.7% |
| 11 | 70.4% |
| 12 | 68.4% |
| 13 | 66.7% |
| 14 | 65.3% |
| 15 | 64.4% |
| 16 | 63.9% |
| 17 | 63.4% |
| 18 | 63.1% |
| 19 | 63.3% |
| 20 | 63.9% |
The pass rate falls steadily until about age 18, where it bottoms out at 63.1%. After that it rises again, because the cars still on the road at 20 or more are the survivors and the cherished: neglected cars have been scrapped. That is why we compare models over ages 3 to 10, where every popular model has plenty of tests at every age.
So that a model with a young fleet is not flattered, and one with an old fleet not penalised, each model's like-for-like pass rate is its pass rate at each age from 3 to 10, averaged with the same age weights for every model. On that measure the average for all cars and vans is 82.0%.
The most reliable used cars
| # | Model | Like for like | All ages | Tests |
|---|---|---|---|---|
| 1 | Porsche 911 | 94.5% | 89.0% | 48,226 |
| 2 | Porsche Boxster | 93.8% | 83.9% | 33,380 |
| 3 | Honda Jazz | 91.4% | 80.6% | 335,539 |
| 4 | Lexus CT | 91.3% | 89.8% | 30,617 |
| 5 | Toyota Prius | 91.0% | 86.8% | 160,840 |
| 6 | Mazda MX-5 | 90.9% | 77.4% | 95,311 |
| 7 | Honda CR-V | 90.1% | 79.5% | 204,614 |
| 8 | Audi TT | 89.6% | 79.0% | 116,372 |
| 9 | Mercedes-Benz SL | 89.4% | 84.9% | 22,122 |
| 10 | Porsche Cayenne | 88.9% | 86.4% | 29,546 |
| 11 | Toyota RAV4 | 88.7% | 83.6% | 91,695 |
| 12 | MINI Countryman | 88.7% | 89.2% | 88,259 |
| 13 | Skoda Citigo | 87.8% | 86.9% | 52,665 |
| 14 | Honda Civic | 87.7% | 74.3% | 299,187 |
| 15 | Toyota Auris | 87.5% | 82.0% | 158,476 |
Sports and luxury cars lead the table, but read them with care: a Porsche 911 or Boxster covers far fewer miles than a family car (about 24,000 miles at ages 3 to 10 for the 911, against 53,000 for the average ranked car), is often garaged, and is usually maintained by owners who can afford to. The more useful result for most buyers sits just below them. The Honda Jazz, a cheap and common small car with 335,539 tests, passed 91.4% of the time like for like. The Toyota Prius, Honda CR-V, Toyota RAV4, Skoda Citigo, Honda Civic and Toyota Auris also make the top 15.
The "all ages" column is the plain pass rate across every test of that model. It is lower than the like-for-like rate for models with many old cars still on the road, such as the Jazz and the MX-5, and higher for younger fleets.
The least reliable used cars
| # | Model | Like for like | All ages | Tests |
|---|---|---|---|---|
| 1 | Renault Clio | 71.2% | 63.2% | 342,150 |
| 2 | Renault Megane | 73.2% | 61.5% | 121,442 |
| 3 | Peugeot 5008 | 73.4% | 74.3% | 29,307 |
| 4 | Citroen C4 | 76.1% | 67.9% | 141,093 |
| 5 | Dacia Sandero | 76.5% | 78.1% | 99,940 |
| 6 | SEAT Ibiza | 77.1% | 72.2% | 195,989 |
| 7 | Vauxhall Insignia | 77.2% | 73.4% | 218,483 |
| 8 | Renault Scenic | 77.3% | 62.9% | 44,724 |
| 9 | Vauxhall Corsa | 77.3% | 71.3% | 948,473 |
| 10 | Peugeot 3008 | 78.0% | 76.3% | 127,601 |
| 11 | Volvo V40 | 78.2% | 76.5% | 100,926 |
| 12 | Renault Twingo | 78.2% | 68.5% | 26,208 |
| 13 | Peugeot 308 | 78.7% | 71.5% | 141,659 |
| 14 | Nissan Juke | 78.8% | 75.8% | 299,185 |
| 15 | Dacia Duster | 78.8% | 82.3% | 64,616 |
The Renault Clio is the clearest outlier: a very common car (342,150 tests) that passes 86.3% of the time at 3 years old but only 59.3% at 10. Several high-volume small cars also sit in the bottom 15, including the Vauxhall Corsa (77.3%) and the SEAT Ibiza. That does not make every one a bad buy, but it does mean a used example is more likely than average to need work to pass, and its MOT history deserves a careful read.
Vans and pickups, ranked separately
Vans, pickups and van-based people carriers are kept out of the car rankings above. They work harder and cover more miles, so they would crowd the bottom: 17 of the bottom 20 models across all 148 are commercial. Among the 29 of them, the Mitsubishi L200 did best at 81.9% and the Renault Kangoo worst at 67.2%.
Show all 29 vans and pickups
| # | Model | Like for like | All ages | Tests |
|---|---|---|---|---|
| 1 | Mitsubishi L200 | 81.9% | 75.9% | 78,544 |
| 2 | Volkswagen Amarok | 81.6% | 82.0% | 22,708 |
| 3 | Volkswagen Transporter | 80.4% | 72.8% | 315,340 |
| 4 | Fiat Ducato | 80.1% | 75.9% | 95,994 |
| 5 | Toyota Hilux | 78.8% | 74.3% | 72,537 |
| 6 | Volkswagen Caddy | 78.7% | 74.4% | 148,895 |
| 7 | Isuzu D-Max | 77.1% | 77.7% | 35,425 |
| 8 | Ford Ranger | 76.8% | 76.0% | 106,269 |
| 9 | Mercedes-Benz Vito | 76.2% | 72.7% | 97,029 |
| 10 | Peugeot Boxer | 75.9% | 74.9% | 104,939 |
| 11 | Peugeot Expert | 75.1% | 72.5% | 61,509 |
| 12 | Nissan Navara | 74.9% | 72.4% | 74,020 |
| 13 | Ford Transit | 74.8% | 71.0% | 951,359 |
| 14 | Mercedes-Benz Sprinter | 74.5% | 73.0% | 211,162 |
| 15 | Peugeot Partner | 74.4% | 72.0% | 152,999 |
| 16 | Fiat Doblo | 74.1% | 69.4% | 49,303 |
| 17 | Citroen Berlingo | 73.0% | 69.2% | 190,230 |
| 18 | Volkswagen Crafter | 72.4% | 72.3% | 60,549 |
| 19 | Iveco Daily | 72.4% | 67.7% | 38,031 |
| 20 | Renault Master | 71.9% | 67.3% | 70,230 |
| 21 | Citroen Dispatch | 71.1% | 68.8% | 52,335 |
| 22 | Mercedes-Benz Citan | 70.9% | 72.1% | 20,306 |
| 23 | Citroen Relay | 70.8% | 68.8% | 63,380 |
| 24 | Nissan NV200 | 70.4% | 66.6% | 26,275 |
| 25 | Vauxhall Movano | 70.1% | 66.7% | 51,019 |
| 26 | Vauxhall Combo | 69.4% | 66.9% | 107,867 |
| 27 | Renault Trafic | 67.7% | 64.0% | 125,608 |
| 28 | Vauxhall Vivaro | 67.6% | 63.9% | 229,686 |
| 29 | Renault Kangoo | 67.2% | 61.9% | 59,516 |
Which cars age best
A high pass rate at three years old says little about a car you might buy at eight or ten. For the 107 car models with at least 500 tests at both 3 and 10 years old, we compared the two.
Show the data
Held up best
| Model | Age 3 | Age 10 | Drop (points) |
|---|---|---|---|
| Porsche Boxster | 94.0% | 91.9% | 2.1 |
| Porsche 911 | 95.2% | 92.7% | 2.5 |
| Toyota Prius | 92.1% | 86.7% | 5.4 |
| Audi Q7 | 90.0% | 84.6% | 5.4 |
| Mercedes-Benz CLS | 83.2% | 76.3% | 6.9 |
| Audi TT | 92.5% | 85.5% | 7.0 |
| Mercedes-Benz CLA | 87.1% | 80.0% | 7.1 |
| Lexus CT | 93.1% | 85.8% | 7.3 |
Fell furthest
| Model | Age 3 | Age 10 | Drop (points) |
|---|---|---|---|
| Renault Captur | 91.5% | 62.7% | 28.8 |
| Suzuki SX4 | 94.5% | 65.7% | 28.8 |
| Nissan Qashqai | 91.7% | 63.2% | 28.5 |
| Nissan Juke | 90.7% | 63.0% | 27.7 |
| Renault Clio | 86.3% | 59.3% | 27.0 |
| Hyundai Santa Fe | 91.1% | 64.1% | 27.0 |
| Hyundai ix20 | 93.5% | 66.7% | 26.8 |
| Peugeot 2008 | 91.7% | 65.9% | 25.8 |
The typical car loses 16.7 points between 3 and 10. The Porsche Boxster loses 2.1, and the Toyota Prius goes only from 92.1% to 86.7%. At the other end, several small SUVs and crossovers that do well when new fall hard: the Renault Captur goes from 91.5% at 3 years old to 62.7% at 10, the Nissan Qashqai from 91.7% to 63.2% and the Nissan Juke from 90.7% to 63.0%. If you are shopping for an older example of one of these, budget for repairs and look closely at its last two or three MOTs.
Does mileage explain it?
Partly, but less than you might think. Across car models, typical mileage and the like-for-like pass rate are only weakly related (correlation -0.17): each extra 10,000 miles of typical use goes with about 0.5 points lower pass rate.
The Toyota Prius is the standout. Popular with taxi and private hire drivers, it averages 108,000 miles at these ages, yet passes 91.0% like for like, about 10 points above what its mileage would predict. The Renault Clio, at a typical 47,000 miles, does about 12 points worse. The table shows the five models furthest above the line and the five furthest below.
| Model | Typical miles | Like for like | Against the line |
|---|---|---|---|
| Toyota Prius | 108,000 | 91.0% | +10.3 |
| Porsche 911 | 24,000 | 94.5% | +9.7 |
| Porsche Boxster | 27,000 | 93.8% | +9.1 |
| Lexus CT | 53,000 | 91.3% | +7.9 |
| Honda Jazz | 33,000 | 91.4% | +7.0 |
| Citroen C4 | 57,000 | 76.1% | -7.1 |
| Dacia Sandero | 46,000 | 76.5% | -7.2 |
| Peugeot 5008 | 61,000 | 73.4% | -9.6 |
| Renault Megane | 59,000 | 73.2% | -9.9 |
| Renault Clio | 47,000 | 71.2% | -12.5 |
What this means if you are buying
- Use the rankings to choose a shortlist, not a car. A model's average says how likely a typical example is to fail. The car in front of you has its own history, and a well-kept Clio can be a better buy than a neglected Jazz.
- The older the car, the more the model matters. At three years old, car models pass between 83% to 96% of the time. By ten the range is 59% to 93%, so for an older car favour models that age well.
- Read the car's own MOT history. Look for repeated advisories on the same part, corrosion notes and mileage that jumps or goes backwards. Our guide to reading an MOT history explains what to look for.
- Check the model's common failures. Each model in the tables links to its MOT statistics page, with the failures and advisories it gets most and what to check at a viewing.
How we did it
Data. Every initial MOT test (not retests) of cars and light vans (MOT classes 4 and 7) in Great Britain in 2023, from the DVSA anonymised MOT dataset: 33,842,940 tests. A test counts as a pass if the car passed, including when minor faults were fixed during the test.
Age is whole years from first registration to the test date.
Models are grouped by the first word of the DVSA model name, so "FOCUS ZETEC" and "FOCUS ST" are both the Ford Focus. Names that cover several different models (such as BMW "SERIES" or Mercedes-Benz "CLASS") are left out, and a few families mix close relatives: the Land Rover Discovery figures include the Discovery Sport.
Like-for-like pass rate. For each model, the pass rate at each age from 3 to 10, weighted by the share of all tests at that age, so every model is compared with the same age mix.
Thresholds. A model is ranked only with at least 20,000 tests in total and at least 50 at every age from 3 to 10: 148 models qualify, 119 cars and 29 vans and pickups (20.3 million tests of the ranked cars). The ageing comparison needs at least 500 tests at both 3 and 10 years old. Typical mileage is each age's median odometer reading, averaged with the same age weights.
Vans and pickups were identified by model name. DVSA does not record whether a vehicle is a car or a van, and some van names (Berlingo, Partner, Caddy, Kangoo, Doblo, Combo) also cover passenger versions.
Precision. With so many tests the sampling error is small: the 95% interval on a like-for-like rate is at most ±1.3 points and typically ±0.3. Models a point or so apart should still be treated as level.
Caveats. An MOT pass rate measures roadworthiness on the day of the test, not breakdowns, engine or gearbox failures, or running costs. It also reflects how owners look after their cars: models bought by careful, low-mileage owners will do better for reasons that are not about the car. Results are for tests in 2023, so the newest models are not yet in the 3 to 10 year band.
Reproduce it. Every figure and chart here is generated by a script from the bundled cohort data, scripts/blog/most-reliable-used-cars-mot-pass-rates.py. The model pages under MOT statistics use the same data and the same method.