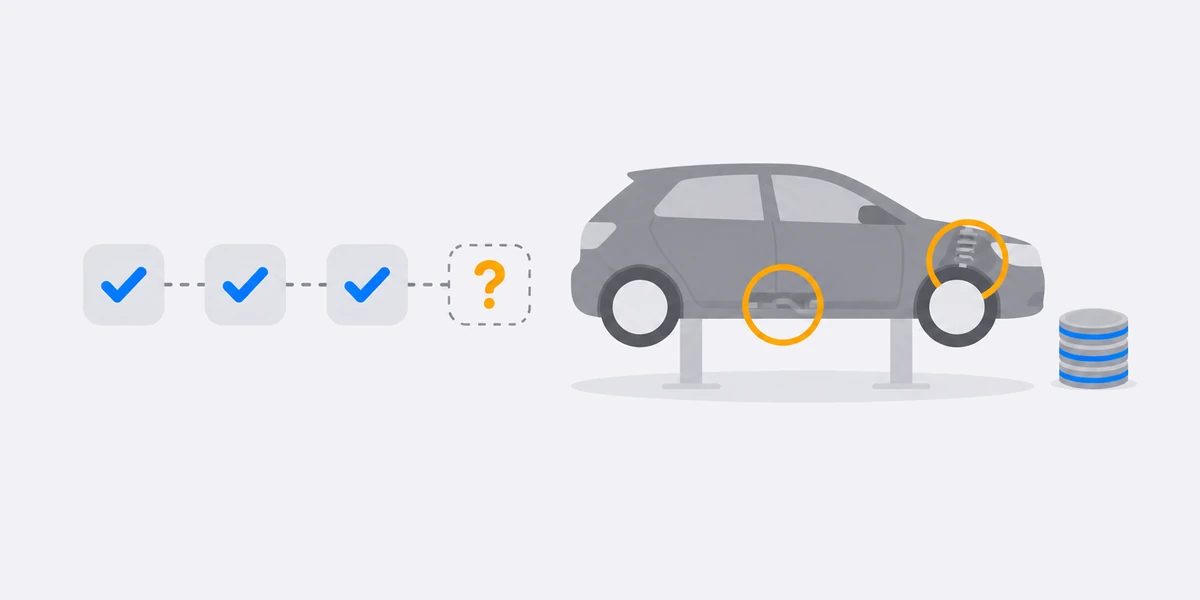
Key findings
- Twice as good as knowing the make and model. At telling which cars will fail their next MOT, our model scores about 0.43 above a coin toss, against 0.20 for make and model alone. Of the 10% it rated riskiest, 61% failed, against 30% of all cars. The biggest clue is the car's own MOT record.
- It beat the best average on all 23 parts we predict, and most clearly on faults that build up slowly, such as brake pipes and structural rust.
- Same car, different history, different odds. Two 2012 Fiestas* with the same engine, age and mileage: 27% with a clean record, 46% with brake-pipe and tyre advisories and two past fails. Any average gives them the same number.
- The odds become an estimated bill. Priced at typical independent-garage rates, the predicted cost of the next MOT's failures tracked the actual failures closely, from the cheapest tenth of cars to the dearest.
- Tested on cars it had never seen. Trained on earlier years and tested on 2.9 million cars' 2024 MOTs, then checked by an independent review.
* Illustrative cars: we chose a typical age, mileage and MOT history for a 2012 Fiesta to show how the record alone changes the odds. The percentages are the model's real output for those details.
The data
DVSA publishes every MOT test in Great Britain as open data, under the Open Government Licence. Each record carries an anonymous vehicle number rather than a registration, so a car's tests can be followed over the years. We used every car and light van test from 2015 to 2024: 357 million tests on 50.3 million vehicles. We drop the location fields, and we never link these records to registration plates.
What the model looks at
For each car, the model looks at its age and mileage, its model, the engine and platform it shares with cars from other brands, and above all its own MOT record: what has been advised and what has failed before, part by part.
The record is what lifts it above an average. An average knows how a typical 2012 Fiesta does; the record knows how this one has been doing. Take the record away and the model falls back to roughly where the best average sits.
Under the hood it asks thousands of small questions, each correcting the last, the same family of methods insurers use to price risk.
How well it works
Twice as good as knowing the make and model
Measured by how far each method beats a coin toss at telling which cars will fail, our model scores about 0.43 against 0.20 for make and model alone, and 0.35 for the best simple average by make, model, age and mileage.
Put another way: of the 10% of cars it rated riskiest, 61% failed their next MOT, against 30% of all cars.
Part by part
The model does best on faults that show up as advisories before they fail. Of the 1% of cars it flagged for brake pipes, 14% failed on them, against 7% for the best average and 1.1% of all cars. For structural rust, its riskiest 1% failed 24% of the time, against 0.9% of all cars.
It is weakest on tyres, wipers and bulbs, wear items that depend on how the owner looks after the car rather than on the car itself.
How we tested it
A model can look brilliant if it is marked on questions it has already seen. It was trained on earlier years and tested on 2024, a year it had not seen, and on 2,896,255 cars that played no part in training. We scored two simple averages on exactly the same cars: a make and model average, and a sharper one by make, model, age and mileage. An independent review then rebuilt test inputs from the raw records and recomputed the headline figures; in the checks it ran, it found no leakage of the answer into the inputs.
One condition matters: the test covers cars that came back for their next MOT about a year later. Cars scrapped, exported or off the road in between are not in it.
Same Fiesta, different record
Two 2012 Ford Fiesta 1.25 petrols at 78,000 miles. One has a clean MOT record. The other passed its last MOT with brake-pipe and tyre advisories, and has failed twice before.
A make and model average gives both cars 34%. The model gives 27% and 46%. Its chance of failing on brake pipes is 5.8% for the second car, 2.6 times the Fiesta average, against 0.6% for the clean one. These are associations learned from millions of cars, not a diagnosis: the advised pipes may have been replaced since, which is exactly what to ask the seller.
Shared engines help models it has never seen
Many cars share engines and platforms across brands. For common models this adds almost nothing: the model already has plenty of MOTs for every popular car. It matters when a model is new to it. To test that, we hid a selection of models from training entirely and asked it to predict them cold. Knowing what each one shares with other cars brought its predictions closer to what actually happened in most cases.
The Citroen C1 is the clearest case. It rarely fails on springs (0.77% of cars in 2024), far below the Citroen average of 5.1%. Without the shared engine, the model guessed 2.2%; knowing it shares its engine and platform with the Toyota Aygo, it guessed 1.2%. It is not magic: the Ford Ka shares a platform with the Fiat 500 but breaks springs far more often (7.6%), and sharing only moved the guess to 2.7%. A twin is a good first guess, not a substitute for a model's own data. These results hold for the models we selected; a few were still visible to the model under another name.
From odds to money
A buyer does not need 23 percentages. They need a figure. So we priced the work behind each part at typical independent-garage rates, adjusted for the size and type of car, and combined it with the odds.
For the two Fiestas, the estimated cost of the next MOT's failures is about £100 for the car with advisories and £50 for the clean one. These are estimates from typical prices, not quotes, and the prices have not yet been checked against real repair bills.
How the estimates held up
We ran the same 2.9 million unseen cars through the cost estimate and compared it with their actual 2024 failures, priced the same way. That tests whether we predicted the right failures, not whether our prices are right.
The estimate stayed within £10 of the priced failures in every tenth of cars, from £13 a car in the safest tenth to £294 in the riskiest. A make and model average squeezes every car into £27 to £198, too high for the good cars and too low for the bad ones. The 10% of cars we ranked most expensive accounted for 32% of all the priced failures, against 20% for the make and model average. It does worst on classics over 25 years old, which it over-predicts.
The limits
- It predicts MOT results, not general reliability. An MOT inspects brakes, tyres, steering, suspension, lights, emissions, leaks and rust. It does not test how well the engine, gearbox or clutch work, so neither do we.
- Prices are typical, not your invoice. They are independent-garage prices with no regional adjustment, and they have not been validated against real bills.
- Odds, not a diagnosis. A 46% chance means that of cars with a record like this, about that many failed. The car in front of you may already have had the work done.
- Cars that come back. Predictions describe cars that return for their next MOT about a year later.
- The world moves. Failure rates change from year to year, so the model needs retraining as each new year of data arrives.
What it means if you are buying
- Read the record, not just the result. A pass with advisories on brake pipes, rust or suspension is a strong signal for the next MOT. Our guide to reading an MOT history shows what to look for.
- Turn advisories into questions. Ask whether each advised item has been fixed, and for the invoice; if not, its cost is fair to raise. Then check it at the viewing with our viewing checklist.
- Use averages for a shortlist. Our most reliable used cars ranking and the MOT statistics by model tell you which models to favour; the car's own record tells you about the one in front of you.
What's coming in RegTail
We are building this into the RegTail report: for a car you look up, the chance it fails its next MOT, the parts most likely to be the reason and why, and an estimated cost. Before it goes live, we have to make sure the MOT history we fetch for each car reads exactly the way the model learned it, and test that carefully. Until then, these results describe the research, not a feature you can use today.
How we did it
Data. DVSA anonymised MOT tests and results, Open Government Licence v3.0: car and light van tests in Great Britain, 2015 to 2024, 357,451,442 tests. Location fields are dropped; no registration plate is used or linked.
Question. For a car at one MOT, which parts fail at the first test of its next MOT, about a year later. A pass after a repair made during the test counts as a fail.
Testing. Trained on earlier years; tested on 2,921,491 next MOTs in 2024 on 2,896,255 cars not used in training. Both averages were scored on the same cars. The score in the chart is the Gini coefficient, 2 × AUC − 1, where 0 is a coin toss and 1 is perfect: 0.43 for our model (0.71 AUC), 0.35 for the best simple average (0.68) and 0.20 for make and model (0.60). Hit rates are the share of each method's riskiest 1% or 10% that failed; the AUC is the chance a randomly chosen failing car is rated riskier than a randomly chosen passing one. An independent review recomputed the headline figures and found no leakage in the checks it ran.
Costs. Typical independent-garage prices including VAT for common MOT repairs, adjusted for the size and type of car. The cost test prices each car's actual 2024 failures with the same prices, so it measures the failure prediction, not the prices.
Caveats. MOT-inspected items only; typical prices, not quotes, and not yet validated against bills; associations, not causes; cars that did not return for their next MOT are outside the test; classic cars are over-predicted.
Reproduce it. The figures and charts here are generated by scripts/blog/predicting-next-mot-failures-and-repair-costs.py from the published outputs of the research.